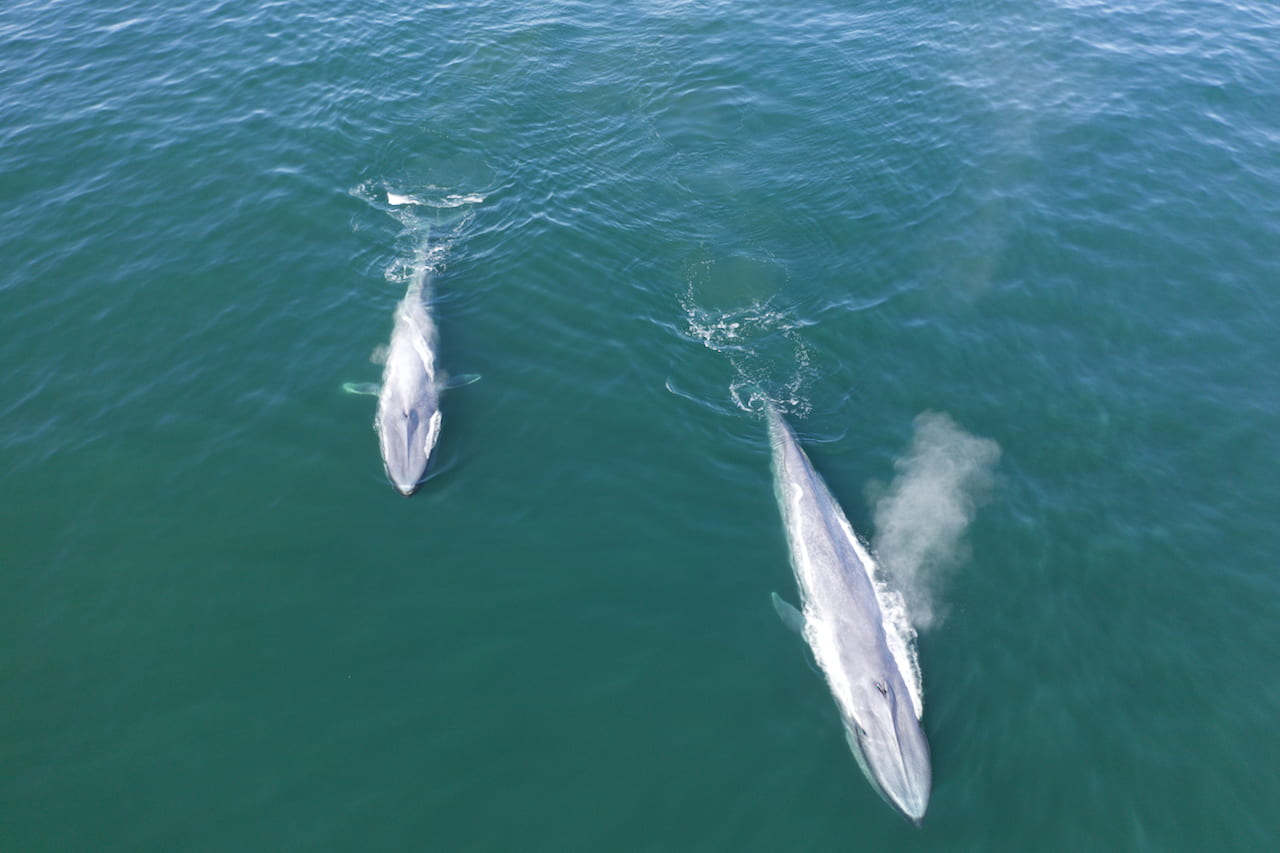
Megan’s recent paper uses NOAA’s RREAS cruise data to look at combined krill biomass from net-tows and differences in habitat use between T. Spinifera and E. Pacifica in the California Current. The paper highlights the issues that arise when modeling a species complex rather than individual species habitat preferences. Getting species identification will help partition net tow data in addition to fisheries acoustic measurements of krill biomass moving forward. Krill also had broad scale response to oceanic warming from El Niño events Also not surprising, predictions of high krill biomass corresponded with top predator sightings as well.
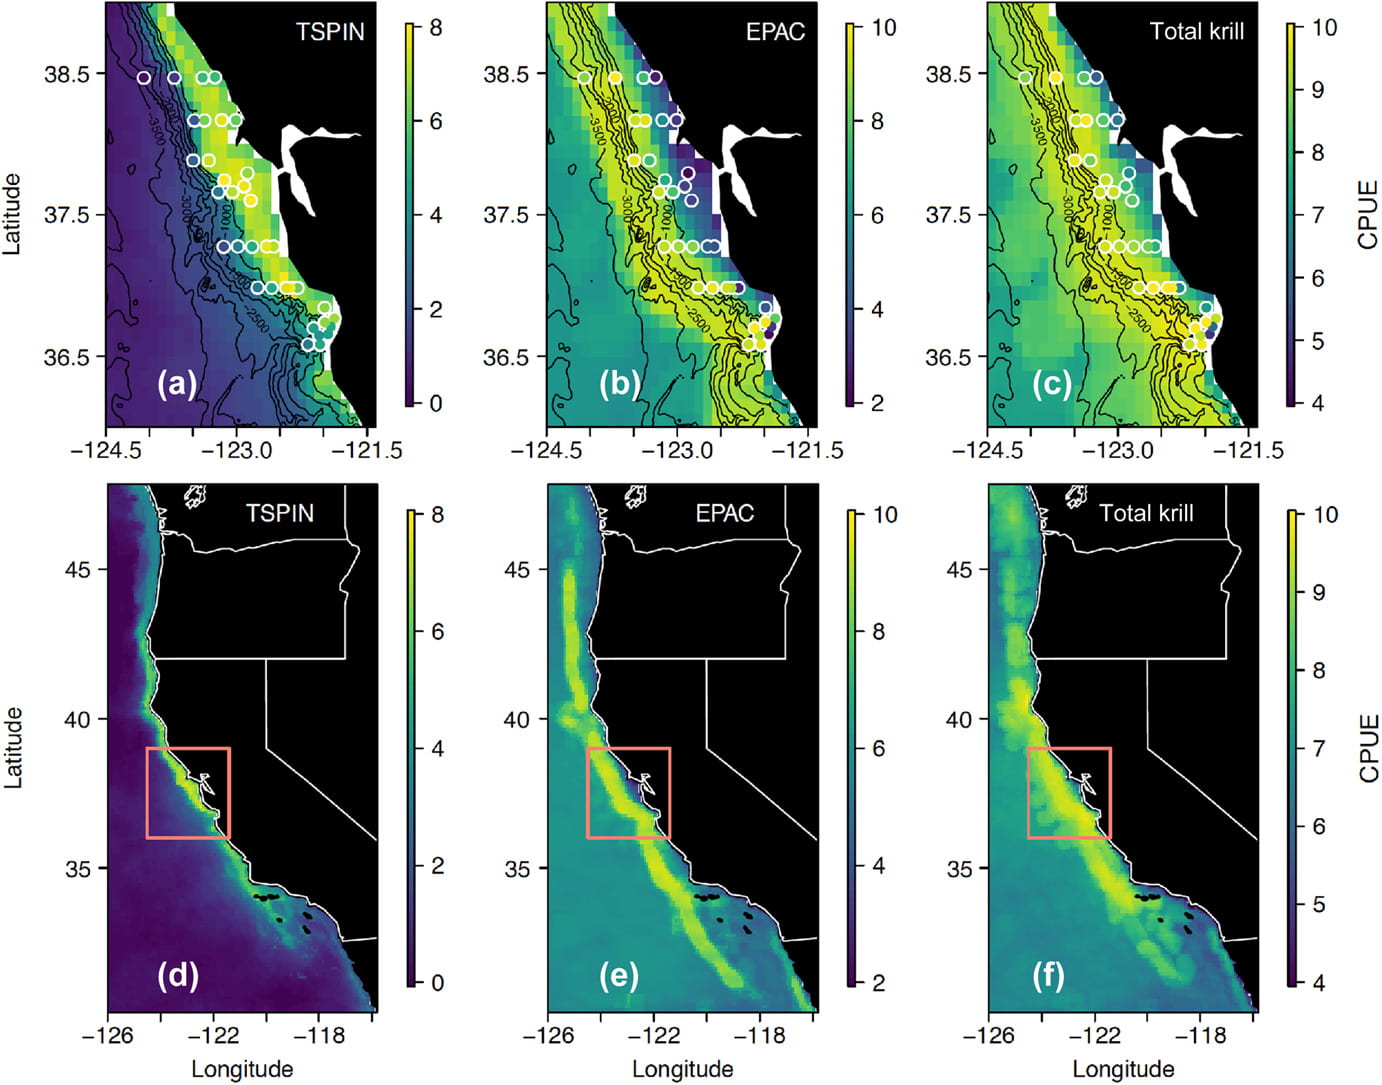
Fig. 4: Climatology (temporal mean) of predicted ln(CPUE + 1) for krill from the Full model along the central California coast (top panel) and along the U.S. West Coast (bottom panel) from 2002 to 2018 for (a, d) TSPIN, (b, e) EPAC, and (c, f) total krill. Points in (a–c) are mean observations from the mid‐water trawl sampling stations. Bathymetry line contours (contour interval of 500 m) are shown in black. The red box in (d–f) represents the region shown in (a–c).
M.A. Cimino, J.A. Santora, I. Schroeder, W. Sydeman, M.G. Jacox, E.L. Hazen, S.J. Bograd. 2020. Essential krill species habitat resolved by seasonal upwelling and ocean circulation models within the large marine ecosystem of the California Current System. Ecography. DOI: 10.1111/ecog.05204. PDF