New publication in Science Advances led by Tim White at Stanford

By combining species distribution models from Hazen et al. 2013 with Global Fishing Watch data from Kroodsma et al. 2018, White et al. assesses overlap between tunas and sharks and Pacific fishing vessels. In addition, the manuscript assesses which species occur within North American Exclusive Economic Zones versus the open ocean requiring different approaches towards management.

There has been a good discussion on how scale effects overlap calculations for GFW data as well by Amaroso et al. and in the Kroodsma et al. response finding that “fished area” could be between 4% and 55% depending on the scale of calculation. Both articles provide a valid rationale for why their scale was chosen. The work here was conducted on a coarse spatial scale, so it is highly likely that overlap would decrease if finer resolution data were available, yet this scale is appropriate for the ecosystem footprint of much of the gear and the top predator models as well.

Figure 1

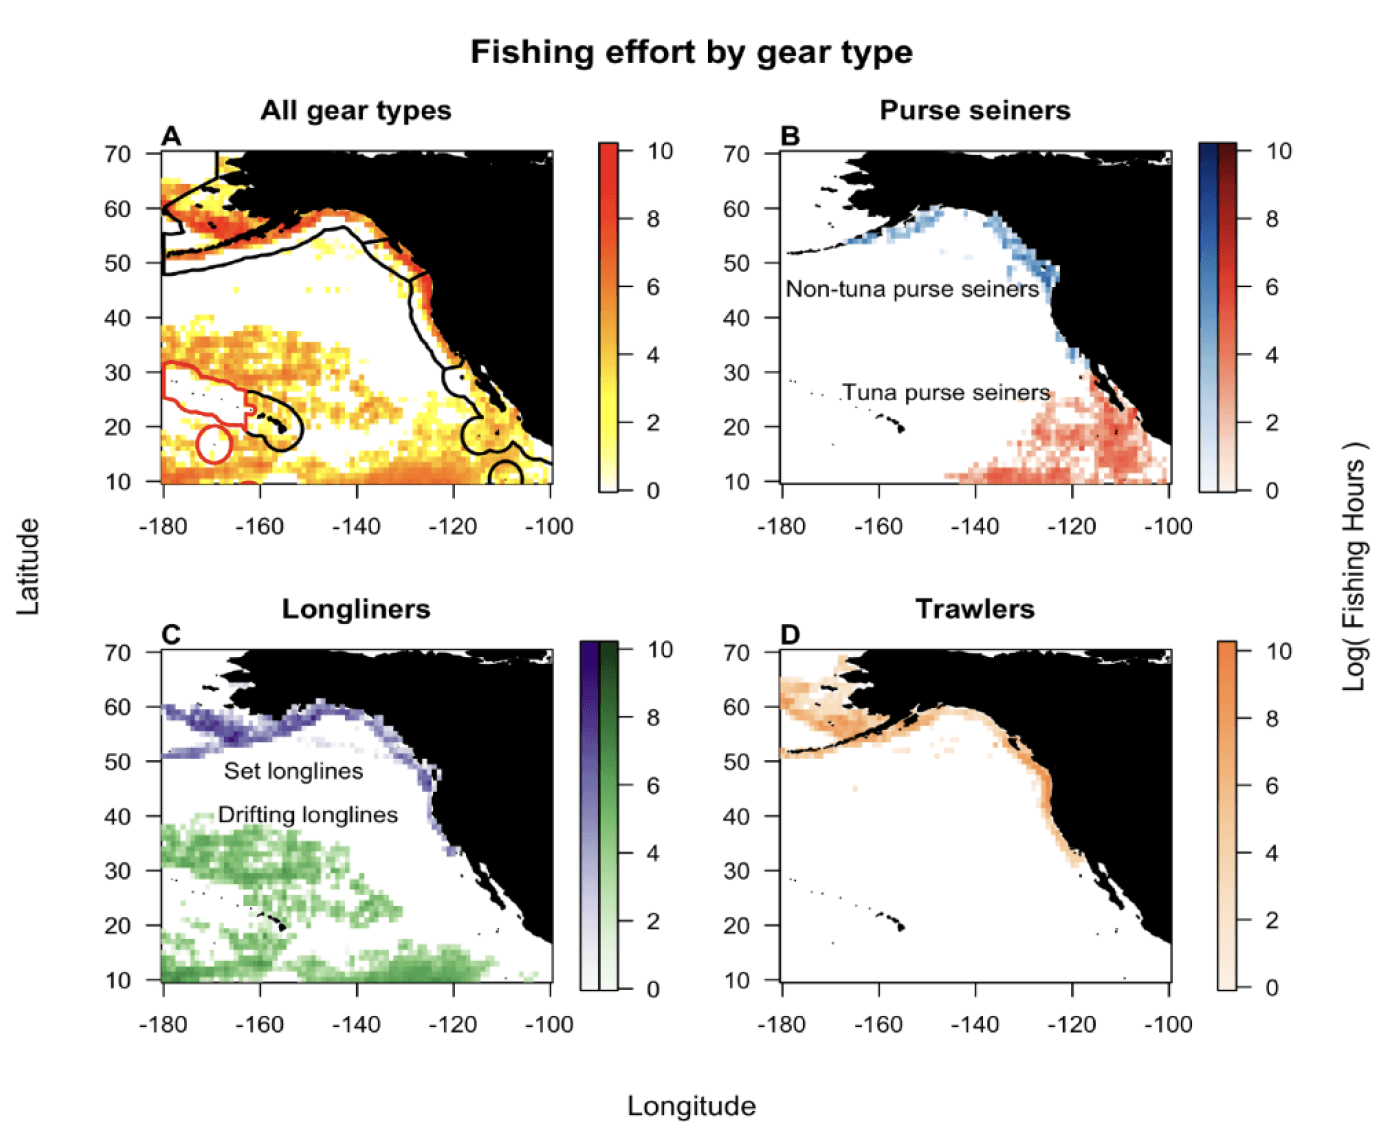
Many species of sharks and tunas are threatened by overexploitation, yet the degree of overlap between industrial fisheries and pelagic fishes remains poorly understood. Using  satellite tracks from 1,007 industrial fishing vessels in conjunction with predictive habitat models built using 2,406 electronic tags deployed on seven pelagic shark and tuna species, we developed fishing effort maps by gear type across the Northeast Pacific Ocean and assessed overlap with core habitats of pelagic fishes. We found that up to 35% of species’ core habitats overlapped with industrial fishing effort and identified overlap hotspots along the North American continental shelf, the equatorial Pacific, and Mexico’s Exclusive Economic Zone. Our results indicate which species require international, high seas conservation efforts for effective management (e.g., 90% of blue shark overlap and 48% of albacore tuna overlap occurs in international waters) and which may be effectively managed by single nations (e.g., 75% of salmon shark overlap occurs in U.S. waters). Vessels flagged to just 5 nations (Mexico, China, Taiwan, Japan, and the U.S.) account for the vast majority (> 95%) of overlap with core habitats of our focal sharks and tunas on the high seas. These results may inform ongoing, global negotiations over national fishing rights and conservation priorities to achieve sustainability on the high seas.

T.D. White, F. Ferretti, D.A. Kroodsma, E.L. Hazen, A.B. Carlisle, K.L. Scales, S.J. Bograd, B.A. Block, 2018. Predicted hotspots of overlap between highly migratory fishes and industrial fishing fleets in the Northeast Pacific. Science Advances. PDF

Abrahms et al. publish in PNAS on Memory and resource tracking drive blue whale migrations

Blue whales are the largest animals to every exist on earth but feed on some of the smallest animals on earth, so they need to eat a huge amount of krill to meet their energy needs. Blue whales are estimated to eat 8,000 pounds of krill per day! So it’s important they’re able to find enough food as they’re migrating up the coast of North America. Rather than surfing the contemporaneous “green wave,” the whales can hedge their bets by going with the average timing they’ve experienced in the past. This suggests memory or social communication over basin scales may be at play. From a commentary by William Fagan, “The ultimate analysis and results underpinning conclusions about memory-driven movement in whales are deceptively simple, but the data-intensive process to get there underscores just how much integration is necessary to make progress in cognitive movement ecology.”

B. Abrahms, E.L. Hazen, E.O. Aikens, M.S. Savoca, J.A. Goldbogen, S.J. Bograd, M. Jacox, L. M. Irvine, D.M. Palacios, B.R. Mate, 2019. Memory and resource tracking drive blue
whale migrations. Proceedings of the National Academy of Sciences, 10.1073/pnas.1819031116. PDF


Continue reading

Runcie et al. publish on Bluefin tuna habitat preference derived from three different fisheries in Fisheries Oceanography

Not all fisheries dependent data tell the same story. Runcie et al. 2018 in Fisheries Oceanography shows how different fisheries and different gears show different preferences when fit with habitat models. It highlights an inherent difficulty in understanding the underlying habitat of a highly migratory predator from spatially restricted datasets.

Continue reading

New publication: “Heirarchical foraging movement of humpback whales relative to the structure of their prey,” by Theresa Kirchner

I joined the Stellwagen Bank National Marine Sanctuary research team in 2005 and completed a large part of my PhD research there on fine scale foraging decisions of humpback whales. Theresa, a recent graduate from OSU, picked up the torch looking at the role of prey in structuring predator foraging decisions, using two vessels, archival tags, and EK60 acoustics. Kirchner et al. found that whale foraging bout size was linked to inter-patch-interval thus highlighting the role that spatial scale of prey plays in structuring the environment.

T. Kirchner, D. Wiley. E. Hazen, S. Parks, L. Torres, A. Friedlaender, 2018. Hierarchical foraging movement of humpback whales relative to the structure of their prey. Marine Ecology Progress Series. 607:237-250. doi: 10.3354/meps12789. PDF

Continue reading

New publication by Heather Welch titled “Environmental indicators to reduce loggerhead turtle bycatch offshore of Southern California”

Just because data on rare species bycatch is sparse and from multiple sources does not mean it is useless for fisheries management. Welch et al. show that correlations can be used to assess and improve the enactment of a seasonal closure.

Figure shows SST anomalies were correlated with sightings and increased interactions with loggerhead turtles. Historical closures are shown with black rectangles. Continue reading

New upwelling indices available for California Current (publication by Mike Jacox)

With the Bakun upwelling index almost 30 years old, a new publication by Mike Jacox explores two new indices derived from modeled vertical velocity: CUTI (coastal upwelling and transport index) and BEUTI (biologically effective upwelling and transport index). Mike has also provided a history of the upwelling indices focusing on where the indices agree and diverge. The publication is available in early view at JGR. Continue reading

New publication titled “Practical considerations for operationalizing dynamic management tools” by Heather Welch

When building an operational tool, building the ecological models is only part of the equation. Equally important is ensuring that we have operational tools and regular predictions for use in management. Welch et al. 2018 explore the operational-side of the EcoCast tool, including potential pitfalls and solutions towards decision making. The paper came out in early view in the Journal of Applied Ecology and there is a discussion on the steps involved in creating fisheries nowcasts in the Conversation.

Figure 1. The four stages of operationalizing a dynamic management tool (hollow fill) and internal components (grey fill). The framework is relevant to operationalizing tools at one point in time and does not encompass tool updates as new data become available.

Continue reading

New publication in CJFAS by Isaac Schroeder on “Source water variability as a driver of rockfish recruitment in the California Current Ecosystem”

Elucidating connections between ocean climate variability and change, and recruitment of juvenile fishes to adult populations, is critical for understanding variability in stock-recruit dynamics. Recruitment to adult rockfish populations in the California Current Ecosystem (CCE) is highly variable, leading to short and long-term changes in abundance, productivity, forage availability and potential fisheries yield. We used regional ocean model output, oceanographic data, and a 34-year time series of pelagic juvenile rockfish, to investigate the interaction between changes in CCE source waters as reflected by physical water mass properties and recruitment variability. Specifically, variability of spiciness on upper water isopycnals explains a substantial fraction of the variation in pelagic juvenile rockfish abundance. High rockfish abundances correspond to cooler, fresher waters with higher dissolved oxygen (i.e., minty) conditions, indicative of Pacific Subarctic Water. By contrast, years of low rockfish abundance are associated with warmer, more saline, and more oxygen deficient (i.e., spicy) conditions, reflecting waters of subtropical or equatorial origin. Transport and source waters in the CCE are key factors determining density-independent processes and subsequent recruitment to adult populations.

New publication in Proceedings in the Royal Society B titled “Mesoscale activity facilitates energy gain in a top predator.”

How animal movement decisions interact with the distribution of resources to shape individual performance is a key question in ecology. However, links between spatial and behavioural ecology and fitness consequences are poorly understood because the outcomes of individual resource selection decisions, such as energy intake, are rarely measured. Download the PDF below to read more!

Figure 4 from Abrahms et al 2018 Proceedings B B. Abrahms, K.L. Scales, E.L. Hazen, S.J. Bograd, R.S. Schick, P.W. Robinson, D.P. Costa. 2018. Mesoscale activity facilitates energy gain in a top predator. Proceedings of the Royal Society B, 285: 20181101. DOI: 10.1098/rspb.2018.1101. PDF

New publication on “Integrating Dynamic Subsurface Habitat Metrics Into Species Distribution Models”

Steph Brodie published a manuscript in Frontiers in Marine Science on how we can improve habitat models by including subsurface variables.

Species distribution models (SDMs) have become key tools for describing and predicting species habitats. In the marine domain, environmental data used in modeling species distributions are often remotely sensed, and as such have limited capacity for interpreting the vertical structure of the water column, or are sampled in situ, offering minimal spatial and temporal coverage. Advances in ocean models have improved our capacity to explore subsurface ocean features, yet there has been limited integration of such features in SDMs.

Spider plots from Brodie et al. 2018

Read more below:

S. Brodie, M.G. Jacox, S.J. Bograd, H. Welch, H. Dewar, K.L. Scales, S.M. Maxwell, D.K. Briscoe, C.A. Edwards, L.B. Crowder, R.L. Lewison, and E.L. Hazen. 2018. Integrating dynamic subsurface habitat metrics into species distribution models. Frontiers in Marine Science. DOI: 10.3389/fmars.2018.00219. PDF